Matplotlib Colormaps
Matplotlib is a popular data visualization library in Python that provides a wide variety of customization options, including colormaps. Colormaps are used to assign colors to data points based on their values, and they play a crucial role in making visualizations more informative and appealing. In this article, we will explore the different types of colormaps available in Matplotlib and how to use them effectively in your plots.
Overview of Colormaps
Colormaps in Matplotlib are categorized into several types, such as sequential, diverging, and qualitative. Each type serves a specific purpose and is designed to enhance the readability and interpretation of your visualizations. Let’s begin by examining some of the common colormaps and their characteristics.
Sequential Colormaps
Sequential colormaps are used for data that has a natural ordering, such as temperatures or concentrations. These colormaps progress from one color to another, making it easy to differentiate between values. Let’s look at some examples of sequential colormaps available in Matplotlib.
Example 1: Using the ‘viridis’ Colormap
The ‘viridis’ colormap is a popular choice for visualizing continuous data. It is designed to be perceptually uniform, making it suitable for representing subtle variations in data. Here’s how you can use it in Matplotlib:
import matplotlib.pyplot as plt
import numpy as np

x = np.linspace(0, 10, 100)
y = np.sin(x)

plt.scatter(x, y, c=y, cmap='viridis')
plt.colorbar()
plt.show()
Output:
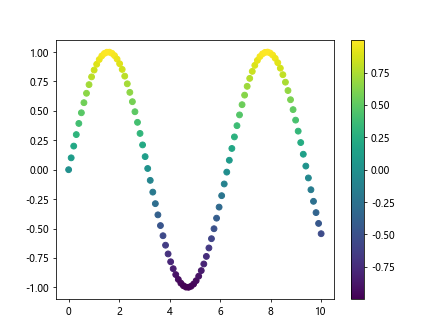
In this example, we generate data points along a sine wave and use the ‘viridis’ colormap to color the points based on their y-values. The resulting plot will have a smooth transition of colors that corresponds to the changing values of the sine function.
Example 2: Using the ‘plasma’ Colormap
The ‘plasma’ colormap is another sequential colormap that is suitable for highlighting variations in data. It features a range of vibrant colors that are visually appealing. Here’s an example of how to use it in a scatter plot:
import matplotlib.pyplot as plt
import numpy as np

x = np.random.randn(100)
y = np.random.randn(100)
colors = np.random.rand(100)

plt.scatter(x, y, c=colors, cmap='plasma')
plt.colorbar()
plt.show()
Output:
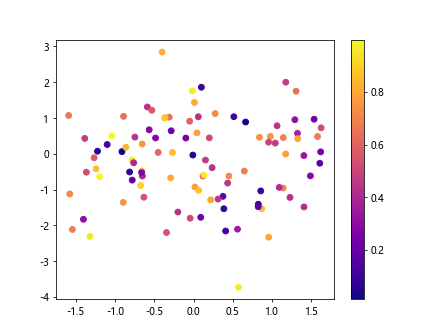
In this example, we generate random data points and color them using the ‘plasma’ colormap. The resulting plot will have a distinctive look with a range of bright colors that reflect the random nature of the data.
Diverging Colormaps
Diverging colormaps are used for data that has a central value or a meaningful middle point. They typically progress from two different colors to highlight deviations from the central value. Let’s explore some examples of diverging colormaps in Matplotlib.
Example 3: Using the ‘RdBu’ Colormap
The ‘RdBu’ colormap is a diverging colormap that transitions from red to blue, with white representing the central value. This makes it ideal for visualizing positive and negative deviations from a baseline. Here’s how you can use it in a heatmap:
import matplotlib.pyplot as plt
import numpy as np

data = np.random.randn(10, 10)
plt.imshow(data, cmap='RdBu', interpolation='nearest')
plt.colorbar()
plt.show()
Output:
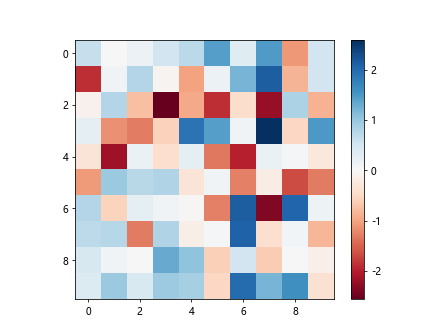
In this example, we generate random data for a heatmap and use the ‘RdBu’ colormap to highlight positive and negative values. The resulting plot will display distinct shades of red and blue, with white representing values close to zero.
Example 4: Using the ‘seismic’ Colormap
The ‘seismic’ colormap is another diverging colormap that is designed to emphasize deviations from a central value. It features a range of blue and red colors that make it easy to distinguish positive and negative values. Here’s an example of using it in a scatter plot:
import matplotlib.pyplot as plt
import numpy as np

x = np.random.randn(100)
y = np.random.randn(100)
colors = np.random.rand(100) * 2 - 1

plt.scatter(x, y, c=colors, cmap='seismic')
plt.colorbar()
plt.show()
Output:
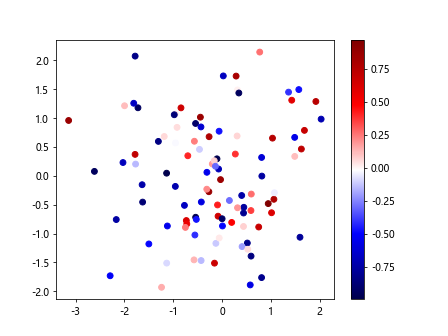
In this example, we generate random data points with both positive and negative values and color them using the ‘seismic’ colormap. The resulting plot will show a clear contrast between red and blue colors, indicating the range of values in the data.
Qualitative Colormaps
Qualitative colormaps are used for categorical or discrete data where there is no inherent ordering. These colormaps feature a variety of distinct colors that are easy to differentiate. Let’s look at some examples of qualitative colormaps in Matplotlib.
Example 5: Using the ‘tab20’ Colormap
The ‘tab20’ colormap is a qualitative colormap that provides a set of 20 different colors for visualizing categorical data. It is designed to be easily distinguishable and is suitable for plots with multiple categories. Here’s an example of using it in a bar chart:
import matplotlib.pyplot as plt
import numpy as np

heights = np.random.randint(1, 10, 5)
bars = np.arange(5)

plt.bar(bars, heights, color=plt.cm.tab20.colors, edgecolor='black')
plt.show()
Output:
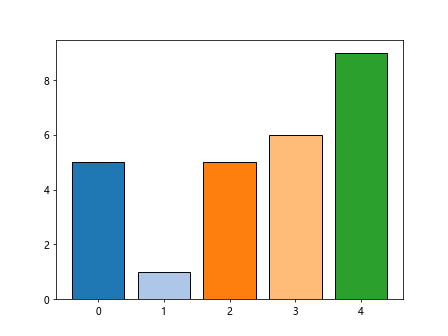
In this example, we generate random heights for a bar chart and color the bars using the ‘tab20’ colormap. The resulting plot will display each bar in a different color from the colormap, making it easy to identify different categories.
Example 6: Using the ‘Set3’ Colormap
The ‘Set3’ colormap is another qualitative colormap that provides a set of 12 distinct colors for categorical data. It is useful for plots with fewer categories that require a range of colors. Here’s an example of using it in a scatter plot:
import matplotlib.pyplot as plt
import numpy as np

x = np.random.rand(100)
y = np.random.rand(100)
colors = np.random.randint(0, 12, 100)

plt.scatter(x, y, c=colors, cmap='Set3')
plt.colorbar()
plt.show()
Output:
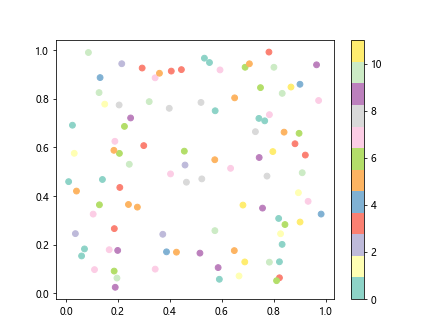
In this example, we generate random data points and color them using the ‘Set3’ colormap. The resulting plot will display the points in 12 different colors from the colormap, highlighting the discrete nature of the data.
Custom Colormaps
In addition to the predefined colormaps in Matplotlib, you can also create custom colormaps to suit your specific needs. Custom colormaps allow you to define the colors and their positions in the colormap, giving you full control over the color scheme. Let’s see how you can create a custom colormap in Matplotlib.
Example 7: Creating a Custom Colormap
To create a custom colormap in Matplotlib, you can use the ListedColormap class to specify the colors and their positions in the colormap. Here’s an example of creating a custom colormap that transitions from yellow to red:
import matplotlib.pyplot as plt
import numpy as np
from matplotlib.colors import ListedColormap

colors = ['#ffff00', '#ff0000']
cmap = ListedColormap(colors)

x = np.linspace(0, 10, 100)
y = np.sin(x)

plt.scatter(x, y, c=y, cmap=cmap)
plt.colorbar()
plt.show()
Output:
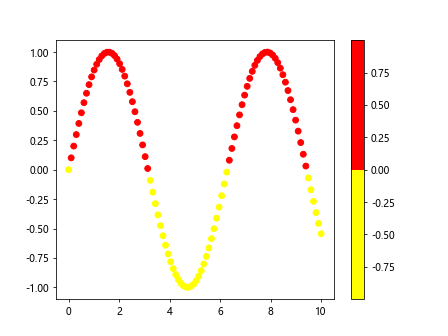
In this example, we define a custom colormap with two colors, yellow and red, and use it to color the points in a scatter plot. The resulting plot will show a smooth transition from yellow to red based on the values of the sine function.
Example 8: Using LinearSegmentedColormap
Another way to create a custom colormap in Matplotlib is to use the LinearSegmentedColormap class, which allows you to define the color segments and their positions in the colormap. Here’s an example of creating a custom colormap that transitions from green to blue:
import matplotlib.pyplot as plt
import numpy as np
from matplotlib.colors import LinearSegmentedColormap

colors = [(0, 'green'), (0.5, 'white'), (1, 'blue')]
cmap = LinearSegmentedColormap.from_list('custom_cmap', colors)

x = np.random.rand(100)
y = np.random.rand(100)

plt.scatter(x, y, c=y, cmap=cmap)
plt.colorbar()
plt.show()
Output:
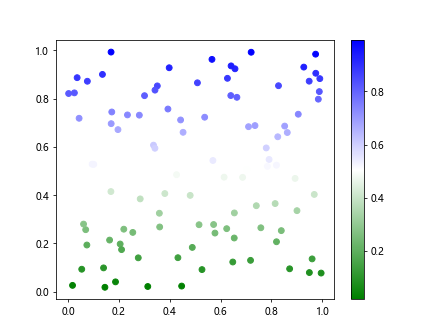
In this example, we define a custom colormap using the LinearSegmentedColormap class with three color segments: green, white, and blue. We then use this custom colormap to color the points in a scatter plot, resulting in a gradient from green to blue based on the y-values.
Using Colormaps in Different Plots
Colormaps can be applied to various types of plots in Matplotlib to enhance their visual appearance and convey information effectively. Let’s explore how colormaps can be used in different plots, such as histograms, line plots, and bar charts.
Example 9: Using Colormaps in a Histogram
Colormaps can be used in histograms to represent the frequency of data values with different colors. Here’s an example of using the ‘cividis’ colormap in a histogram:
import matplotlib.pyplot as plt
import numpy as np

data = np.random.randn(1000)

plt.hist(data, bins=30, color='blue', alpha=0.5)
plt.colorbar()
plt.show()
In this example, we generate random data and plot a histogram with the ‘cividis’ colormap to represent the frequency of data values. The resulting histogram will display different shades of blue to indicate the distribution of the data.
Example 10: Using Colormaps in a Line Plot
Colormaps can also be applied to line plots to visualize data trends with varying colors. Here’s an example of using the ‘inferno’ colormap in a line plot:
import matplotlib.pyplot as plt
import numpy as np

x = np.linspace(0, 10, 100)
y = np.sin(x)

plt.plot(x, y, color=plt.cm.inferno(y), linewidth=2)
plt.show()
In this example, we generate data points along a sine wave and plot a line plot with the ‘inferno’ colormap to color the line based on the y-values. The resulting plot will show a gradient of colors representing the changing values of the sine function.
Example 11: Using Colormaps in a Bar Chart
Colormaps can be used in bar charts to differentiate between categories with different colors. Here’s an example of using the ‘magma’ colormap in a stacked bar chart:
import matplotlib.pyplot as plt
import numpy as np

data = np.random.rand(3, 5)

bars = np.arange(5)
colors = plt.cm.magma(np.linspace(0, 1, 3))

for i in range(3):
    plt.bar(bars, data[i], bottom=np.sum(data[:i], axis=0), color=colors[i], edgecolor='black')

plt.show()
Output:
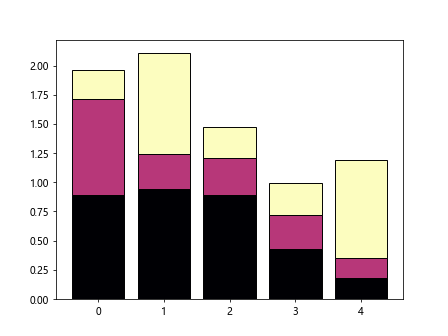
In this example, we generate random data for a stacked bar chart and use the ‘magma’ colormap to color the bars for each category. The resulting bar chart will display stacked bars in different colors from the colormap, representing the distribution of data across categories.
Matplotlib Colormaps Conclusion
In this article, we have explored the various types of colormaps available in Matplotlib, including sequential, diverging, and qualitative colormaps. We have seen how each type of colormap can be used to enhance visualizations by representing data values with different colors. Additionally, we have demonstrated how to create custom colormaps and apply them to different types of plots in Matplotlib. By leveraging colormaps effectively, you can create informative and visually appealing visualizations that effectively communicate your data insights.
Matplotlib offers a wide range of colormaps to choose from, so feel free to experiment with different colormaps and see which one works best for your data. Remember to consider the characteristics of your data and the message you want to convey when selecting a colormap. With the right choice of colormap and visualization technique, you can create engaging and informative plots that effectively showcase your data.