Matplotlib Click Events
Matplotlib is a comprehensive library for creating static, animated, and interactive visualizations in Python. It offers an incredible flexibility that allows users to create plots and graphs that are tailored to their specific needs. One of the interactive features that Matplotlib offers is the ability to handle click events. This feature can be particularly useful for creating interactive plots where the user’s input or interaction can influence the displayed data or trigger certain actions.
In this article, we will explore how to utilize Matplotlib’s capabilities to handle click events within our plots. We will go through various examples that demonstrate how to implement and use click events to enhance the interactivity of Matplotlib plots.
Basic Setup for Click Events
Before diving into the examples, it’s essential to understand the basic setup required to handle click events in Matplotlib. The mpl_connect method of the figure canvas is used to connect an event with a callback function. This callback function is executed whenever the specified event occurs.
Here is a simple example to illustrate this setup:
import matplotlib.pyplot as plt

def on_click(event):
    print(f"Clicked at: {event.xdata}, {event.ydata}")

fig, ax = plt.subplots()
fig.canvas.mpl_connect('button_press_event', on_click)

plt.show()
Output:

In this example, whenever the user clicks within the plot area, the coordinates of the click are printed to the console.
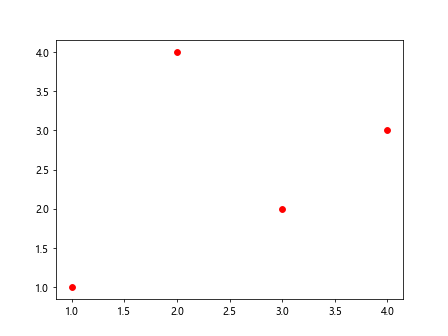
Example 1: Highlighting a Point on Click
Let’s start with a simple example where clicking on the plot highlights the point that was clicked.
import matplotlib.pyplot as plt

fig, ax = plt.subplots()
ax.plot([1, 2, 3, 4], [1, 4, 2, 3], 'ro')

def on_click(event):
    ax.plot(event.xdata, event.ydata, 'bo')
    fig.canvas.draw()

fig.canvas.mpl_connect('button_press_event', on_click)

plt.show()
Output:
Example 2: Display Click Coordinates
In this example, we’ll modify the plot to display the coordinates of the point where the user clicked.
import matplotlib.pyplot as plt

fig, ax = plt.subplots()

def on_click(event):
    ax.annotate(f"({event.xdata:.2f}, {event.ydata:.2f})", (event.xdata, event.ydata))
    fig.canvas.draw()

fig.canvas.mpl_connect('button_press_event', on_click)

plt.show()
Output:

Example 3: Interactive Line Plot
This example demonstrates how to create an interactive line plot where each click adds a new point to the line.
import matplotlib.pyplot as plt

fig, ax = plt.subplots()
xdata, ydata = [], []

line, = ax.plot(xdata, ydata, 'r-')  # Initial empty line

def on_click(event):
    xdata.append(event.xdata)
    ydata.append(event.ydata)
    line.set_data(xdata, ydata)
    fig.canvas.draw()

fig.canvas.mpl_connect('button_press_event', on_click)

plt.show()
Output:

Example 4: Using Right Click to Remove Points
Expanding on the previous example, we can use the right click (button 3) to remove the last point added to the line.
import matplotlib.pyplot as plt

fig, ax = plt.subplots()
xdata, ydata = [], []

line, = ax.plot(xdata, ydata, 'r-')  # Initial empty line

def on_click(event):
    if event.button == 1:  # Left click
        xdata.append(event.xdata)
        ydata.append(event.ydata)
    elif event.button == 3 and xdata:  # Right click
        xdata.pop()
        ydata.pop()
    line.set_data(xdata, ydata)
    fig.canvas.draw()

fig.canvas.mpl_connect('button_press_event', on_click)

plt.show()
Output:

Example 5: Dynamic Annotation on Hover
While not a click event, tracking the mouse movement and displaying dynamic annotations can enhance interactivity. Here’s how to show coordinates as the mouse moves over the plot.
import matplotlib.pyplot as plt

fig, ax = plt.subplots()
annotation = ax.annotate("", xy=(0,0), xytext=(20,20),textcoords="offset points",
                         bbox=dict(boxstyle="round", fc="w"))
annotation.set_visible(False)

def on_move(event):
    if event.inaxes == ax:
        annotation.set_text(f"Pos: ({event.xdata:.2f}, {event.ydata:.2f})")
        annotation.xy = (event.xdata, event.ydata)
        annotation.set_visible(True)
        fig.canvas.draw()
    else:
        annotation.set_visible(False)
        fig.canvas.draw()

fig.canvas.mpl_connect('motion_notify_event', on_move)

plt.show()
Output:
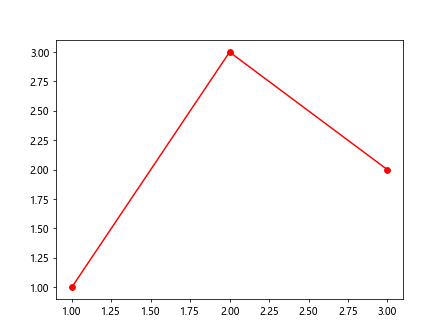
Example 6: Toggle Visibility of Elements
This example shows how clicking on a plot element can toggle its visibility.
import matplotlib.pyplot as plt

fig, ax = plt.subplots()
line, = ax.plot([1, 2, 3], [1, 3, 2], 'ro-')

def on_click(event):
    if line.contains(event)[0]:
        line.set_visible(not line.get_visible())
        fig.canvas.draw()

fig.canvas.mpl_connect('button_press_event', on_click)

plt.show()
Output:
Example 7: Interactive Scatter Plot
Creating an interactive scatter plot where clicking adds a new point.
import matplotlib.pyplot as plt

fig, ax = plt.subplots()
sc = ax.scatter([], [])

def on_click(event):
    xdata = sc.get_offsets()[:,0].tolist() + [event.xdata]
    ydata = sc.get_offsets()[:,1].tolist() + [event.ydata]
    sc.set_offsets(list(zip(xdata, ydata)))
    fig.canvas.draw()

fig.canvas.mpl_connect('button_press_event', on_click)

plt.show()
Output:
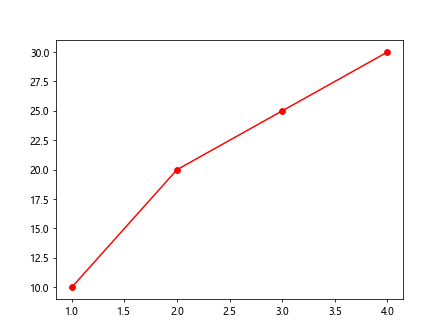
Example 8: Changing Plot Style on Click
This example changes the plot style every time the plot area is clicked.
import matplotlib.pyplot as plt
import itertools

fig, ax = plt.subplots()
line, = ax.plot([1, 2, 3, 4], [10, 20, 25, 30], 'ro-')

styles = itertools.cycle(['ro-', 'gx-', 'b^-', 'ys-', 'md-'])

def on_click(event):
    line.set_linestyle(next(styles))
    fig.canvas.draw()

fig.canvas.mpl_connect('button_press_event', on_click)

plt.show()
Output:
Example 9: Adding Text to Click Location
This example adds a text label at the location of each click, displaying a custom message.
import matplotlib.pyplot as plt

fig, ax = plt.subplots()

def on_click(event):
    ax.text(event.xdata, event.ydata, "how2matplotlib.com", fontsize=9)
    fig.canvas.draw()

fig.canvas.mpl_connect('button_press_event', on_click)

plt.show()
Output:

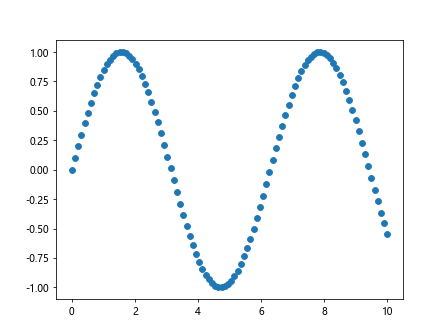
Example 10: Interactive Data Selection
This final example demonstrates how to select data points within a certain radius from the click location, highlighting them.
import matplotlib.pyplot as plt
import numpy as np

x = np.linspace(0, 10, 100)
y = np.sin(x)

fig, ax = plt.subplots()
sc = ax.scatter(x, y)

def on_click(event):
    tolerance = 0.1  # Radius of selection
    click_x = event.xdata
    click_y = event.ydata

    distances = np.sqrt((x - click_x)**2 + (y - click_y)**2)
    selected = distances < tolerance
    sc.set_facecolor(np.where(selected, 'r', 'b'))
    fig.canvas.draw()

fig.canvas.mpl_connect('button_press_event', on_click)

plt.show()
Output:
Conclusion
Handling click events in Matplotlib opens up a wide range of possibilities for creating interactive visualizations. By connecting events to callback functions, you can dynamically modify your plots in response to user input, enhancing the user experience and making your plots more informative and engaging. Whether you're adding new data points, annotating your plot, or implementing custom interactive behaviors, Matplotlib's event handling capabilities provide the tools you need to create highly interactive and responsive visualizations.