How can I make Matplotlib.pyplot stop forcing the style of my markers?
When working with Matplotlib, a common issue that users may encounter is the automatic styling of markers within plots. This can be frustrating when you want to customize the appearance of your plots to fit a particular aesthetic or when you need to adhere to specific style guidelines for publication. In this article, we will explore how to gain full control over the style of markers in Matplotlib plots, ensuring that your markers look exactly the way you want them to.
Understanding Marker Styles in Matplotlib
Before we dive into customizing marker styles, it’s important to understand the basics of how markers are styled in Matplotlib. Markers are used in plots to represent data points, and their style includes attributes such as shape, size, color, and edge properties.
Matplotlib provides a variety of marker styles that can be used out-of-the-box, including simple shapes like circles, squares, and triangles, as well as more complex symbols like stars and hexagons. The default marker style is usually a simple blue circle, but this can be easily changed.
Customizing Marker Styles
To customize marker styles in Matplotlib, you can use the marker, markersize, markeredgecolor, markeredgewidth, and markerfacecolor parameters of plotting functions like plot, scatter, and others. These parameters allow you to specify the shape, size, edge color, edge width, and face color of the markers, respectively.
Let’s look at some examples of how to customize marker styles in Matplotlib. Each example will be a standalone code snippet that you can run directly to see the effect of the customization.
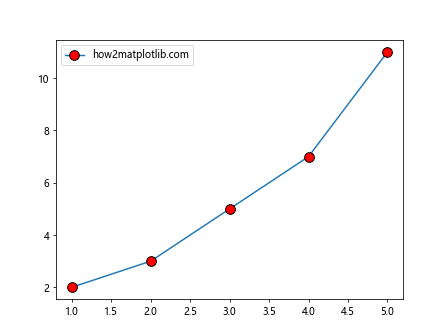
Example 1: Basic Custom Marker Style
import matplotlib.pyplot as plt

x = [1, 2, 3, 4, 5]
y = [2, 3, 5, 7, 11]

plt.plot(x, y, marker='o', markersize=10, markeredgecolor='black', markerfacecolor='red', label='how2matplotlib.com')
plt.legend()
plt.show()
Output:
Example 2: Changing Marker Shape
import matplotlib.pyplot as plt

x = [1, 2, 3, 4, 5]
y = [2, 3, 5, 7, 11]

plt.plot(x, y, marker='s', markersize=8, markeredgecolor='green', markerfacecolor='yellow', label='how2matplotlib.com')
plt.legend()
plt.show()
Output:

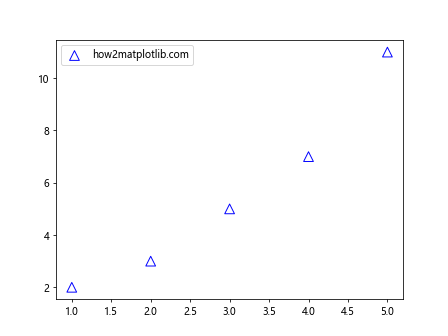
Example 3: Using Custom Markers with Scatter Plot
import matplotlib.pyplot as plt

x = [1, 2, 3, 4, 5]
y = [2, 3, 5, 7, 11]

plt.scatter(x, y, marker='^', s=100, edgecolor='blue', facecolor='none', label='how2matplotlib.com')
plt.legend()
plt.show()
Output:
Example 4: No Edge Color on Markers
import matplotlib.pyplot as plt

x = [1, 2, 3, 4, 5]
y = [2, 3, 5, 7, 11]

plt.plot(x, y, marker='D', markersize=12, markeredgecolor='none', markerfacecolor='magenta', label='how2matplotlib.com')
plt.legend()
plt.show()
Output:

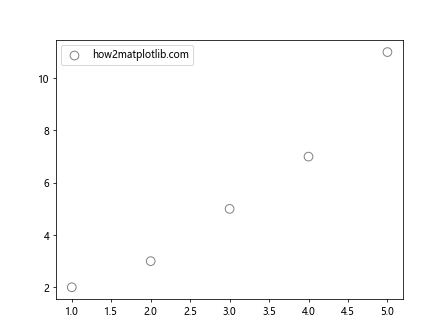
Example 5: Transparent Markers
import matplotlib.pyplot as plt

x = [1, 2, 3, 4, 5]
y = [2, 3, 5, 7, 11]

plt.scatter(x, y, marker='o', s=80, edgecolor='black', facecolor='none', alpha=0.5, label='how2matplotlib.com')
plt.legend()
plt.show()
Output:
Example 6: Custom Marker with Hexagon Shape
import matplotlib.pyplot as plt

x = [1, 2, 3, 4, 5]
y = [2, 3, 5, 7, 11]

plt.plot(x, y, marker='h', markersize=15, markeredgecolor='orange', markerfacecolor='cyan', label='how2matplotlib.com')
plt.legend()
plt.show()
Output:

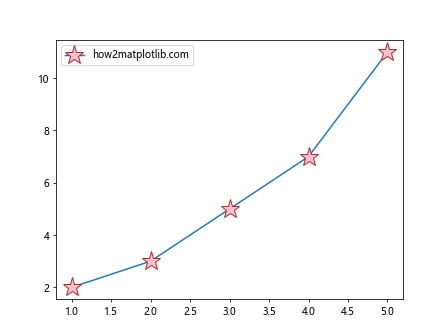
Example 7: Star-Shaped Markers
import matplotlib.pyplot as plt

x = [1, 2, 3, 4, 5]
y = [2, 3, 5, 7, 11]

plt.plot(x, y, marker='*', markersize=20, markeredgecolor='brown', markerfacecolor='pink', label='how2matplotlib.com')
plt.legend()
plt.show()
Output:
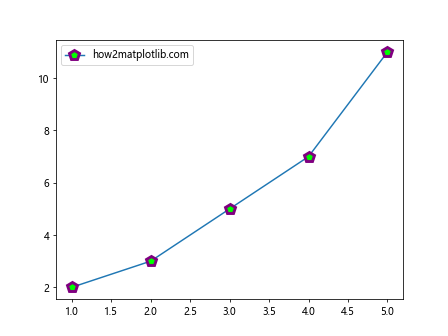
Example 8: Markers with Different Edge Width
import matplotlib.pyplot as plt

x = [1, 2, 3, 4, 5]
y = [2, 3, 5, 7, 11]

plt.plot(x, y, marker='p', markersize=10, markeredgewidth=3, markeredgecolor='purple', markerfacecolor='lime', label='how2matplotlib.com')
plt.legend()
plt.show()
Output:
Example 9: Combining Line and Marker Styles
import matplotlib.pyplot as plt

x = [1, 2, 3, 4, 5]
y = [2, 3, 5, 7, 11]

plt.plot(x, y, linestyle='--', marker='o', markersize=12, markeredgecolor='navy', markerfacecolor='orange', label='how2matplotlib.com')
plt.legend()
plt.show()
Output:

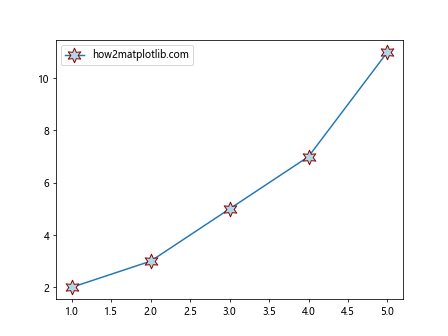
Example 10: Custom Marker with Path
import matplotlib.pyplot as plt
import matplotlib.path as mpath

star = mpath.Path.unit_regular_star(6)
x = [1, 2, 3, 4, 5]
y = [2, 3, 5, 7, 11]

plt.plot(x, y, marker=star, markersize=15, markeredgecolor='darkred', markerfacecolor='lightblue', label='how2matplotlib.com')
plt.legend()
plt.show()
Output:
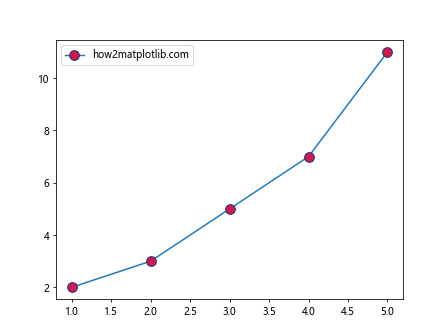
Example 11: Markers with Custom RGB Colors
import matplotlib.pyplot as plt
import matplotlib.path as mpath

x = [1, 2, 3, 4, 5]
y = [2, 3, 5, 7, 11]

plt.plot(x, y, marker='o', markersize=10, markeredgecolor=(0.1, 0.2, 0.5), markerfacecolor=(0.8, 0.1, 0.3), label='how2matplotlib.com')
plt.legend()
plt.show()
Output:
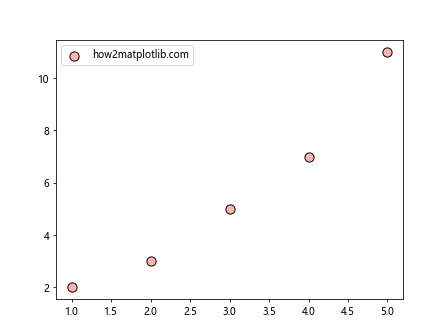
Example 12: Markers with Custom RGBA Colors
import matplotlib.pyplot as plt
import matplotlib.path as mpath

x = [1, 2, 3, 4, 5]
y = [2, 3, 5, 7, 11]

plt.scatter(x, y, marker='o', s=90, edgecolor=(0, 0, 0, 1), facecolor=(1, 0, 0, 0.3), label='how2matplotlib.com')
plt.legend()
plt.show()
Output:
Example 13: Custom Marker with Unicode Character
import matplotlib.pyplot as plt
import matplotlib.path as mpath

x = [1, 2, 3, 4, 5]
y = [2, 3, 5, 7, 11]

plt.plot(x, y, marker='$\u2665$', markersize=20, markeredgecolor='black', markerfacecolor='red', label='how2matplotlib.com')
plt.legend()
plt.show()
Output:

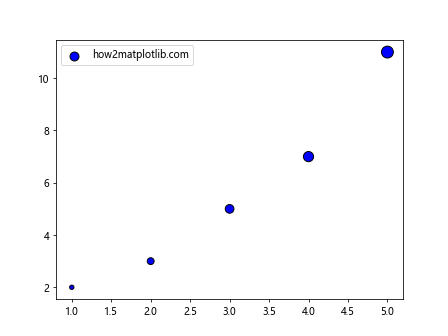
Example 14: Markers with Different Sizes
import matplotlib.pyplot as plt
import matplotlib.path as mpath

x = [1, 2, 3, 4, 5]
y = [2, 3, 5, 7, 11]
sizes = [20, 50, 80, 110, 150]

plt.scatter(x, y, marker='o', s=sizes, edgecolor='black', facecolor='blue', label='how2matplotlib.com')
plt.legend()
plt.show()
Output:
Example 15: Custom Marker with Image
import matplotlib.pyplot as plt
import matplotlib.path as mpath
from matplotlib.offsetbox import OffsetImage, AnnotationBbox

# Load an image
img = plt.imread('path_to_image.png')

fig, ax = plt.subplots()
x = [1, 2, 3, 4, 5]
y = [2, 3, 5, 7, 11]

for xi, yi in zip(x, y):
    im = OffsetImage(img, zoom=0.1)
    ab = AnnotationBbox(im, (xi, yi), frameon=False)
    ax.add_artist(ab)

ax.set_xlim(0, 6)
ax.set_ylim(0, 12)
ax.set_title('how2matplotlib.com')
plt.show()
Example 16: Custom Marker with Error Bars
import matplotlib.pyplot as plt

x = [1, 2, 3, 4, 5]
y = [2, 3, 5, 7, 11]
yerr = [0.2, 0.3, 0.2, 0.3, 0.2]

plt.errorbar(x, y, yerr=yerr, fmt='o', markersize=10, markeredgecolor='red', markerfacecolor='yellow', label='how2matplotlib.com')
plt.legend()
plt.show()
Output:

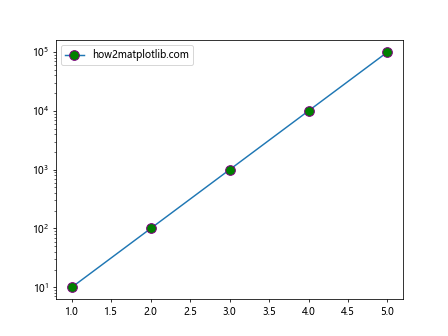
Example 17: Custom Marker with Logarithmic Scale
import matplotlib.pyplot as plt

x = [1, 2, 3, 4, 5]
y = [10, 100, 1000, 10000, 100000]

plt.semilogy(x, y, marker='o', markersize=10, markeredgecolor='purple', markerfacecolor='green', label='how2matplotlib.com')
plt.legend()
plt.show()
Output:
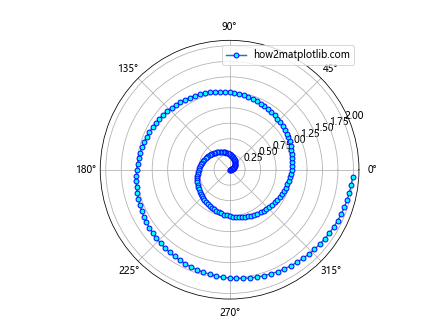
Example 18: Custom Marker with Polar Coordinates
import matplotlib.pyplot as plt
import numpy as np

r = np.arange(0, 2, 0.01)
theta = 2 * np.pi * r

fig = plt.figure()
ax = fig.add_subplot(111, polar=True)
ax.plot(theta, r, marker='o', markersize=5, markeredgecolor='blue', markerfacecolor='cyan', label='how2matplotlib.com')
ax.legend()
plt.show()
Output:
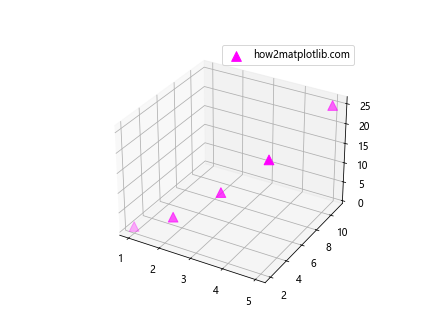
Example 19: Custom Marker with 3D Plot
from mpl_toolkits.mplot3d import Axes3D
import matplotlib.pyplot as plt

fig = plt.figure()
ax = fig.add_subplot(111, projection='3d')

x = [1, 2, 3, 4, 5]
y = [2, 3, 5, 7, 11]
z = [1, 4, 9, 16, 25]

ax.scatter(x, y, z, marker='^', s=100, color='magenta', label='how2matplotlib.com')
ax.legend()
plt.show()
Output:
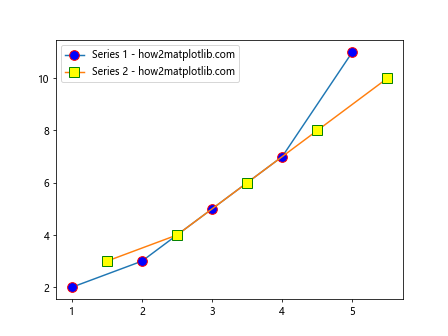
Example 20: Custom Marker with Multiple Data Series
import matplotlib.pyplot as plt

x1 = [1, 2, 3, 4, 5]
y1 = [2, 3, 5, 7, 11]
x2 = [1.5, 2.5, 3.5, 4.5, 5.5]
y2 = [3, 4, 6, 8, 10]

plt.plot(x1, y1, marker='o', markersize=10, markeredgecolor='red', markerfacecolor='blue', label='Series 1 - how2matplotlib.com')
plt.plot(x2, y2, marker='s', markersize=10, markeredgecolor='green', markerfacecolor='yellow', label='Series 2 - how2matplotlib.com')
plt.legend()
plt.show()
Output:
These examples demonstrate a wide variety of ways to customize marker styles in Matplotlib, from changing basic properties like shape and color to using images and Unicode characters as markers. By understanding and utilizing these techniques, you can ensure that the markers in your plots convey exactly the right visual message for your data.