Adjust One Subplot’s Height in an Absolute Way in Matplotlib
When working with Matplotlib, a popular plotting library in Python, adjusting the size and layout of subplots can significantly enhance the clarity and effectiveness of a visualization. While relative adjustments using ratios are common, there are scenarios where adjusting the height of a subplot in an absolute manner is necessary. This article will explore how to adjust the height of a subplot in an absolute way using Matplotlib, providing comprehensive details and multiple examples.
Understanding Subplot Adjustments in Matplotlib
Matplotlib provides several ways to manipulate the layout of plots, including functions like subplots_adjust, tight_layout, and GridSpec. However, these often adjust subplot dimensions relatively. To set the dimensions absolutely, we need to delve deeper into the functionality provided by Matplotlib’s object-oriented interface.
Example 1: Basic Plot Setup
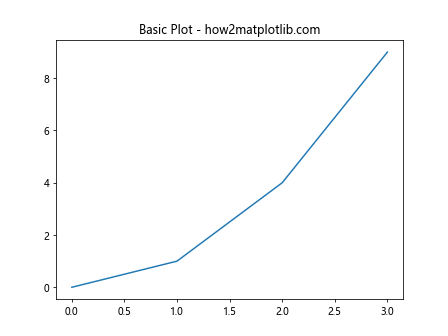
Before adjusting subplot sizes, let’s start with a basic example of creating a single subplot.
import matplotlib.pyplot as plt

fig, ax = plt.subplots()
ax.plot([0, 1, 2, 3], [0, 1, 4, 9])
ax.set_title("Basic Plot - how2matplotlib.com")
plt.show()
Output:
Example 2: Creating Multiple Subplots
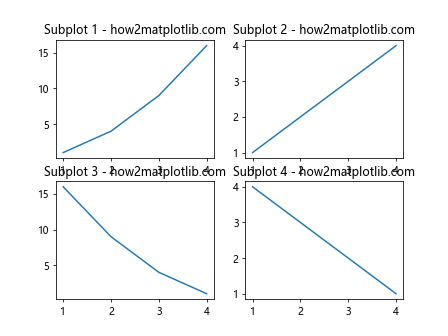
Now, let’s create a figure with multiple subplots.
import matplotlib.pyplot as plt

fig, axs = plt.subplots(2, 2)
axs[0, 0].plot([1, 2, 3, 4], [1, 4, 9, 16])
axs[0, 0].set_title("Subplot 1 - how2matplotlib.com")
axs[0, 1].plot([1, 2, 3, 4], [1, 2, 3, 4])
axs[0, 1].set_title("Subplot 2 - how2matplotlib.com")
axs[1, 0].plot([1, 2, 3, 4], [16, 9, 4, 1])
axs[1, 0].set_title("Subplot 3 - how2matplotlib.com")
axs[1, 1].plot([1, 2, 3, 4], [4, 3, 2, 1])
axs[1, 1].set_title("Subplot 4 - how2matplotlib.com")
plt.show()
Output:
Absolute Size Adjustment Using Figure and Axes
To adjust the height of a subplot in an absolute way, we need to manipulate the figure size or use transformations that allow specifying dimensions in inches or centimeters.
Example 3: Adjusting Subplot Height Absolutely Using set_size_inches
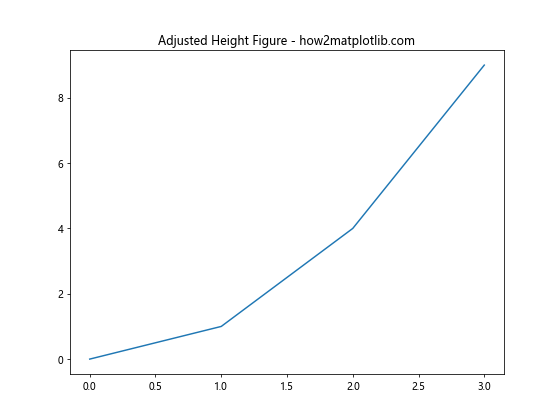
Here, we adjust the height of the entire figure, which indirectly sets the subplot height.
import matplotlib.pyplot as plt

fig, ax = plt.subplots()
fig.set_size_inches(8, 6)  # Width, Height in inches
ax.plot([0, 1, 2, 3], [0, 1, 4, 9])
ax.set_title("Adjusted Height Figure - how2matplotlib.com")
plt.show()
Output:
Example 4: Using GridSpec for Absolute Dimensions
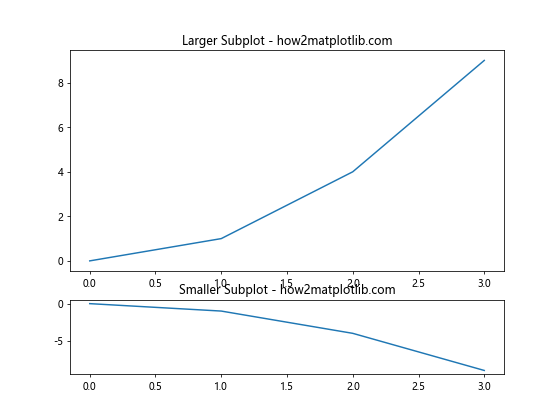
GridSpec can be used for more granular control over subplot sizing.
import matplotlib.pyplot as plt
import matplotlib.gridspec as gridspec

fig = plt.figure(figsize=(8, 6))
gs = gridspec.GridSpec(2, 1, height_ratios=[3, 1])

ax1 = fig.add_subplot(gs[0])
ax1.plot([0, 1, 2, 3], [0, 1, 4, 9])
ax1.set_title("Larger Subplot - how2matplotlib.com")

ax2 = fig.add_subplot(gs[1])
ax2.plot([0, 1, 2, 3], [0, -1, -4, -9])
ax2.set_title("Smaller Subplot - how2matplotlib.com")

plt.show()
Output:
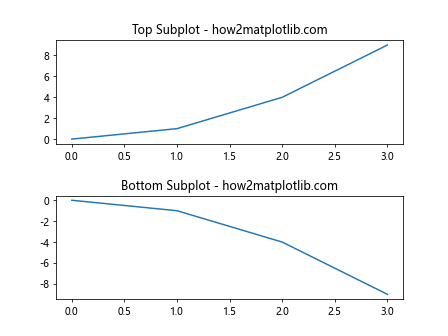
Example 5: Adjusting Subplot Height with subplots_adjust
This method allows adjusting the spacing between subplots but can be used to manipulate height indirectly.
import matplotlib.pyplot as plt
import matplotlib.gridspec as gridspec

fig, axs = plt.subplots(2, 1)
fig.subplots_adjust(hspace=0.5)  # Adjust horizontal space
axs[0].plot([0, 1, 2, 3], [0, 1, 4, 9])
axs[0].set_title("Top Subplot - how2matplotlib.com")
axs[1].plot([0, 1, 2, 3], [0, -1, -4, -9])
axs[1].set_title("Bottom Subplot - how2matplotlib.com")

plt.show()
Output:
Advanced Techniques for Absolute Sizing
For more precise control, we can use transformations and manipulate the axes directly.
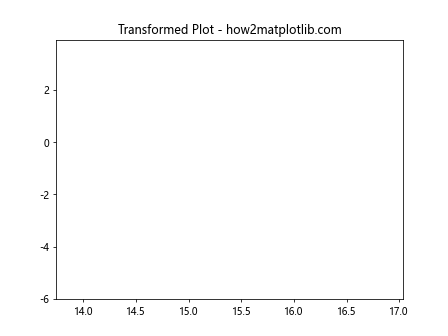
Example 6: Using Transformations to Set Absolute Dimensions
This approach involves using the transformation API to set exact dimensions for subplots.
import matplotlib.pyplot as plt
import matplotlib.gridspec as gridspec
import matplotlib.transforms as transforms

fig, ax = plt.subplots()
trans = transforms.ScaledTranslation(10/72, -4/72, fig.dpi_scale_trans)
ax.plot([0, 1, 2, 3], [0, 1, 4, 9], transform=trans + ax.transData)
ax.set_title("Transformed Plot - how2matplotlib.com")
plt.show()
Output:
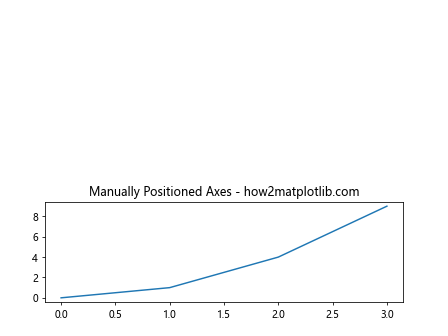
Example 7: Manually Setting Axes Position
Here, we manually set the position of an axes within the figure canvas.
import matplotlib.pyplot as plt
import matplotlib.gridspec as gridspec
import matplotlib.transforms as transforms

fig = plt.figure()
ax = fig.add_axes([0.1, 0.1, 0.8, 0.3])  # left, bottom, width, height
ax.plot([0, 1, 2, 3], [0, 1, 4, 9])
ax.set_title("Manually Positioned Axes - how2matplotlib.com")
plt.show()
Output:
Conclusion
Adjusting the height of subplots in an absolute way in Matplotlib requires a deeper understanding of the library’s layout and transformation capabilities. By using methods like set_size_inches, GridSpec, and manual axes positioning, you can achieve precise control over your plot layouts. This flexibility allows for the creation of visually appealing and well-structured visualizations tailored to specific requirements.
This article has provided a comprehensive guide and multiple examples to help you master absolute subplot adjustments in Matplotlib. Whether you are preparing a scientific publication or a detailed business report, these techniques will enhance your ability to present data effectively.