Add a Legend in a 3D Scatterplot with scatter() in Matplotlib
Adding a legend to a 3D scatterplot in Matplotlib can enhance the visualization by providing context about the different data points. This article will guide you through the process of creating a 3D scatterplot using Matplotlib’s scatter() function and adding a legend to it. We will cover various scenarios and customization options for legends in 3D scatterplots, providing detailed examples along the way.
Introduction to 3D Scatterplots in Matplotlib
A 3D scatterplot is a useful tool for visualizing data that has three dimensions. Matplotlib, a comprehensive library for creating static, animated, and interactive visualizations in Python, offers excellent support for 3D plotting, including scatterplots. Before adding a legend, it’s essential to understand how to set up a 3D scatterplot.
Basic 3D Scatterplot
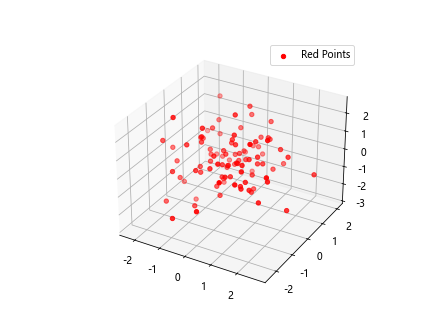
Here’s a basic example of a 3D scatterplot:
import matplotlib.pyplot as plt
from mpl_toolkits.mplot3d import Axes3D
import numpy as np

fig = plt.figure()
ax = fig.add_subplot(111, projection='3d')

x = np.random.standard_normal(100)
y = np.random.standard_normal(100)
z = np.random.standard_normal(100)

scatter = ax.scatter(x, y, z, c='r', label='Red Points')
ax.legend()

plt.show()
Output:
Adding a Legend to a 3D Scatterplot
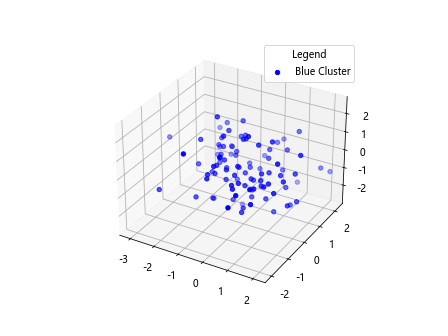
A legend helps differentiate between different groups of data points in the scatterplot. Here’s how you can add a simple legend.
Example 1: Basic Legend
import matplotlib.pyplot as plt
from mpl_toolkits.mplot3d import Axes3D
import numpy as np

fig = plt.figure()
ax = fig.add_subplot(111, projection='3d')

x = np.random.standard_normal(100)
y = np.random.standard_normal(100)
z = np.random.standard_normal(100)

scatter = ax.scatter(x, y, z, c='b', label='Blue Cluster')
ax.legend(title='Legend')

plt.show()
Output:
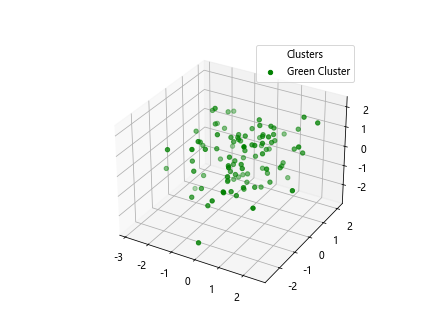
Example 2: Customizing Legend Location
import matplotlib.pyplot as plt
from mpl_toolkits.mplot3d import Axes3D
import numpy as np

fig = plt.figure()
ax = fig.add_subplot(111, projection='3d')

x = np.random.standard_normal(100)
y = np.random.standard_normal(100)
z = np.random.standard_normal(100)

scatter = ax.scatter(x, y, z, c='g', label='Green Cluster')
ax.legend(loc='upper right', title='Clusters')

plt.show()
Output:
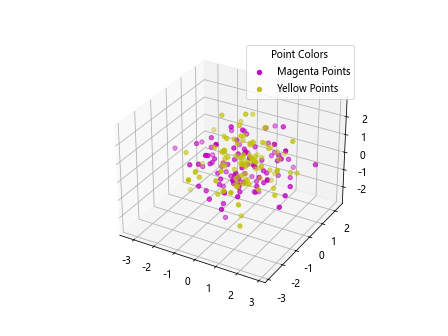
Example 3: Multiple Data Groups
import matplotlib.pyplot as plt
from mpl_toolkits.mplot3d import Axes3D
import numpy as np

fig = plt.figure()
ax = fig.add_subplot(111, projection='3d')

x1 = np.random.standard_normal(100)
y1 = np.random.standard_normal(100)
z1 = np.random.standard_normal(100)
x2 = np.random.standard_normal(100)
y2 = np.random.standard_normal(100)
z2 = np.random.standard_normal(100)

scatter1 = ax.scatter(x1, y1, z1, c='m', label='Magenta Points')
scatter2 = ax.scatter(x2, y2, z2, c='y', label='Yellow Points')
ax.legend(title='Point Colors')

plt.show()
Output:
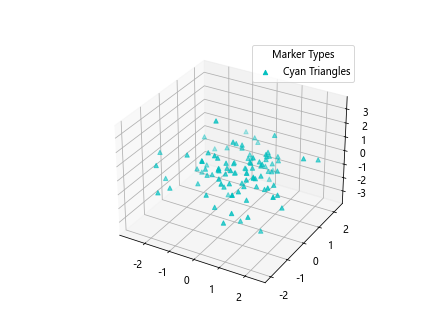
Example 4: Adding a Legend with Custom Markers
import matplotlib.pyplot as plt
from mpl_toolkits.mplot3d import Axes3D
import numpy as np

fig = plt.figure()
ax = fig.add_subplot(111, projection='3d')

x = np.random.standard_normal(100)
y = np.random.standard_normal(100)
z = np.random.standard_normal(100)

scatter = ax.scatter(x, y, z, c='c', marker='^', label='Cyan Triangles')
ax.legend(title='Marker Types')

plt.show()
Output:
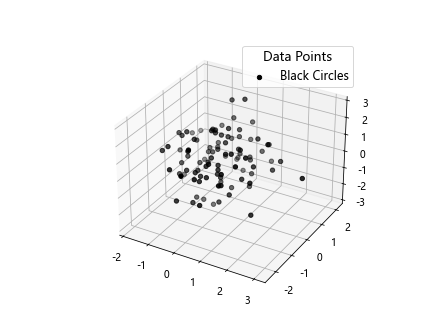
Example 5: Legend with Custom Font Size and Style
import matplotlib.pyplot as plt
from mpl_toolkits.mplot3d import Axes3D
import numpy as np

fig = plt.figure()
ax = fig.add_subplot(111, projection='3d')

x = np.random.standard_normal(100)
y = np.random.standard_normal(100)
z = np.random.standard_normal(100)

scatter = ax.scatter(x, y, z, c='k', marker='o', label='Black Circles')
ax.legend(title='Data Points', fontsize='large', title_fontsize='13', fancybox=True)

plt.show()
Output:
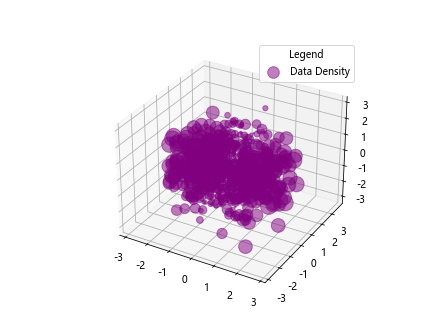
Example 6: Using a Legend to Show Data Density
import matplotlib.pyplot as plt
from mpl_toolkits.mplot3d import Axes3D
import numpy as np

fig = plt.figure()
ax = fig.add_subplot(111, projection='3d')

x = np.random.standard_normal(1000)
y = np.random.standard_normal(1000)
z = np.random.standard_normal(1000)

size = np.abs(x * 100)

scatter = ax.scatter(x, y, z, s=size, c='purple', alpha=0.5, label='Data Density')
ax.legend(title='Legend')

plt.show()
Output:
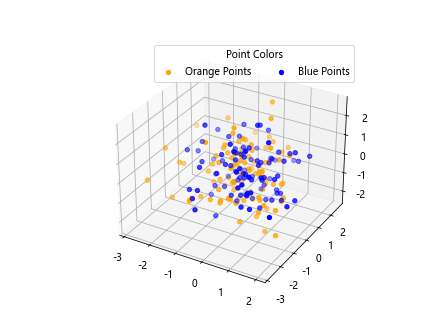
Example 7: Legend with Multiple Columns
import matplotlib.pyplot as plt
from mpl_toolkits.mplot3d import Axes3D
import numpy as np

fig = plt.figure()
ax = fig.add_subplot(111, projection='3d')

x1 = np.random.standard_normal(100)
y1 = np.random.standard_normal(100)
z1 = np.random.standard_normal(100)
x2 = np.random.standard_normal(100)
y2 = np.random.standard_normal(100)
z2 = np.random.standard_normal(100)

scatter1 = ax.scatter(x1, y1, z1, c='orange', label='Orange Points')
scatter2 = ax.scatter(x2, y2, z2, c='blue', label='Blue Points')
ax.legend(title='Point Colors', ncol=2)

plt.show()
Output:
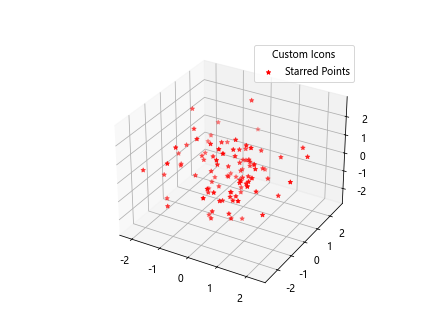
Example 8: Custom Legend Icons
import matplotlib.pyplot as plt
from mpl_toolkits.mplot3d import Axes3D
import numpy as np

fig = plt.figure()
ax = fig.add_subplot(111, projection='3d')

x = np.random.standard_normal(100)
y = np.random.standard_normal(100)
z = np.random.standard_normal(100)

scatter = ax.scatter(x, y, z, c='red', marker='*', label='Starred Points')
ax.legend(title='Custom Icons')

plt.show()
Output:
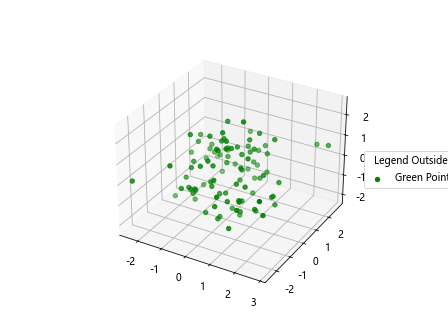
Example 9: Legend Outside the Plot
import matplotlib.pyplot as plt
from mpl_toolkits.mplot3d import Axes3D
import numpy as np

fig = plt.figure()
ax = fig.add_subplot(111, projection='3d')

x = np.random.standard_normal(100)
y = np.random.standard_normal(100)
z = np.random.standard_normal(100)

scatter = ax.scatter(x, y, z, c='green', label='Green Points')
ax.legend(loc='center left', bbox_to_anchor=(1, 0.5), title='Legend Outside')

plt.show()
Output:
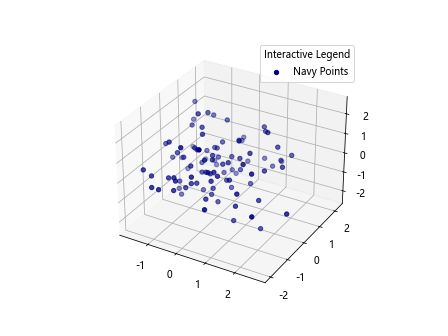
Example 10: Interactive Legend in 3D Plot
import matplotlib.pyplot as plt
from mpl_toolkits.mplot3d import Axes3D
import numpy as np

fig = plt.figure()
ax = fig.add_subplot(111, projection='3d')

x = np.random.standard_normal(100)
y = np.random.standard_normal(100)
z = np.random.standard_normal(100)

scatter = ax.scatter(x, y, z, c='navy', label='Navy Points')
legend = ax.legend(title='Interactive Legend')
legend.set_draggable(True)

plt.show()
Output:
Conclusion
In this article, we explored various ways to add legends to 3D scatterplots using Matplotlib. Legends not only provide a better understanding of the data represented but also enhance the visual appeal of the plots. By customizing the appearance and behavior of legends, you can create more effective and informative visualizations.