Annotating Points from a Pandas DataFrame in Matplotlib Plot
Annotating points in a plot can significantly enhance the readability and interpretability of the visual data representation. This article explores how to annotate points from a Pandas DataFrame using Matplotlib, a powerful plotting library in Python. We will cover various scenarios and styles of annotations, providing detailed examples for each.
Introduction to Matplotlib and Pandas
Matplotlib is a comprehensive library for creating static, animated, and interactive visualizations in Python. Pandas is an open-source data manipulation and analysis library, providing data structures and operations for manipulating numerical tables and time series.
Basic Setup
Before diving into the examples, ensure you have the necessary libraries installed. You can install them using pip:
pip install matplotlib pandas
Importing Libraries
Here’s how you can import the necessary libraries:
import matplotlib.pyplot as plt
import pandas as pd
Example 1: Basic Point Annotation
Let’s start with a simple example where we plot and annotate a single point from a DataFrame.
import matplotlib.pyplot as plt
import pandas as pd

# Create a DataFrame
df = pd.DataFrame({
    'x': [5],
    'y': [10],
    'label': ['Point A']
})

# Plotting
fig, ax = plt.subplots()
ax.scatter(df['x'], df['y'])
ax.annotate('Point A - how2matplotlib.com', (df['x'], df['y']))

plt.show()
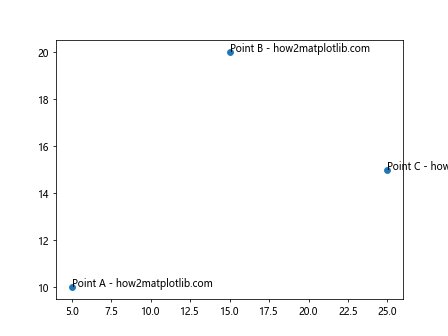
Example 2: Annotating Multiple Points
Expanding on the previous example, we will annotate multiple points.
import matplotlib.pyplot as plt
import pandas as pd

# Create a DataFrame
df = pd.DataFrame({
    'x': [5, 15, 25],
    'y': [10, 20, 15],
    'label': ['Point A', 'Point B', 'Point C']
})

# Plotting
fig, ax = plt.subplots()
ax.scatter(df['x'], df['y'])
for i, txt in enumerate(df['label']):
    ax.annotate(f"{txt} - how2matplotlib.com", (df['x'][i], df['y'][i]))

plt.show()
Output:
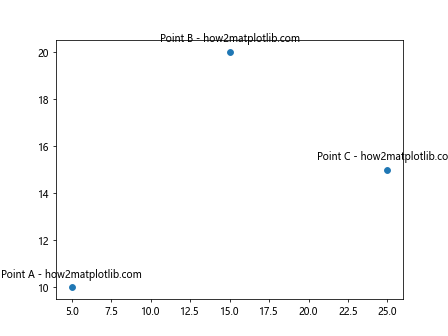
Example 3: Customizing Annotations
Customizing the appearance of annotations to make them more readable.
import matplotlib.pyplot as plt
import pandas as pd

# Create a DataFrame
df = pd.DataFrame({
    'x': [5, 15, 25],
    'y': [10, 20, 15],
    'label': ['Point A', 'Point B', 'Point C']
})

# Plotting
fig, ax = plt.subplots()
ax.scatter(df['x'], df['y'])
for i, txt in enumerate(df['label']):
    ax.annotate(f"{txt} - how2matplotlib.com", (df['x'][i], df['y'][i]),
                textcoords="offset points", xytext=(0,10), ha='center')

plt.show()
Output:
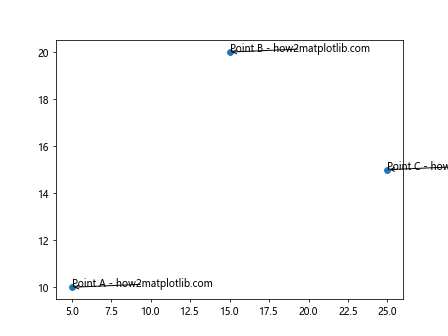
Example 4: Annotating with Arrows
Adding arrows to annotations can help in pointing out the exact data points.
import matplotlib.pyplot as plt
import pandas as pd

# Create a DataFrame
df = pd.DataFrame({
    'x': [5, 15, 25],
    'y': [10, 20, 15],
    'label': ['Point A', 'Point B', 'Point C']
})

# Plotting
fig, ax = plt.subplots()
ax.scatter(df['x'], df['y'])
for i, txt in enumerate(df['label']):
    ax.annotate(f"{txt} - how2matplotlib.com", (df['x'][i], df['y'][i]),
                arrowprops=dict(arrowstyle="->", connectionstyle="arc3"))

plt.show()
Output:
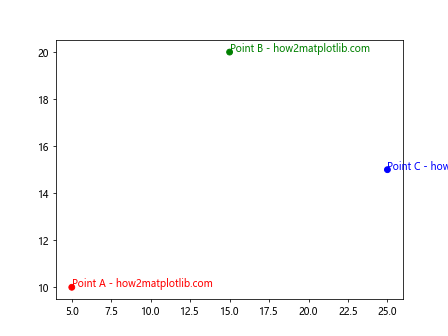
Example 5: Annotating with Different Colors
Using different colors for each annotation can be visually appealing and informative.
import matplotlib.pyplot as plt
import pandas as pd

# Create a DataFrame
df = pd.DataFrame({
    'x': [5, 15, 25],
    'y': [10, 20, 15],
    'label': ['Point A', 'Point B', 'Point C']
})

# Plotting
colors = ['red', 'green', 'blue']
fig, ax = plt.subplots()
sc = ax.scatter(df['x'], df['y'], c=colors)
for i, txt in enumerate(df['label']):
    ax.annotate(f"{txt} - how2matplotlib.com", (df['x'][i], df['y'][i]),
                color=colors[i])

plt.show()
Output:
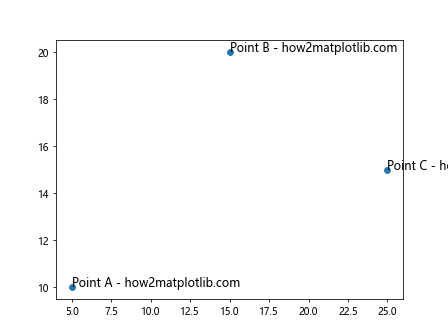
Example 6: Annotating with Font Styles
Changing the font style of annotations to match the theme or emphasis certain points.
import matplotlib.pyplot as plt
import pandas as pd

# Create a DataFrame
df = pd.DataFrame({
    'x': [5, 15, 25],
    'y': [10, 20, 15],
    'label': ['Point A', 'Point B', 'Point C']
})

# Plotting
fig, ax = plt.subplots()
ax.scatter(df['x'], df['y'])
for i, txt in enumerate(df['label']):
    ax.annotate(f"{txt} - how2matplotlib.com", (df['x'][i], df['y'][i]),
                fontstyle='italic', fontsize=12)

plt.show()
Output:
Example 7: Annotating with Text Alignment
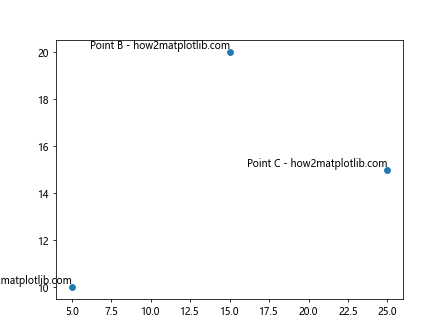
Aligning text in annotations can help in avoiding overlapping with data points or other text.
import matplotlib.pyplot as plt
import pandas as pd

# Create a DataFrame
df = pd.DataFrame({
    'x': [5, 15, 25],
    'y': [10, 20, 15],
    'label': ['Point A', 'Point B', 'Point C']
})

# Plotting
fig, ax = plt.subplots()
ax.scatter(df['x'], df['y'])
for i, txt in enumerate(df['label']):
    ax.annotate(f"{txt} - how2matplotlib.com", (df['x'][i], df['y'][i]),
                ha='right', va='bottom')

plt.show()
Output:
Example 8: Annotating with Background Color
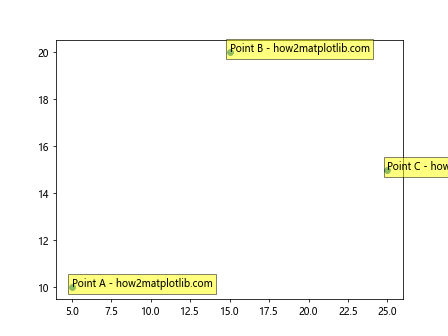
Adding a background color to annotations can enhance readability, especially on busy plots.
import matplotlib.pyplot as plt
import pandas as pd

# Create a DataFrame
df = pd.DataFrame({
    'x': [5, 15, 25],
    'y': [10, 20, 15],
    'label': ['Point A', 'Point B', 'Point C']
})

# Plotting
fig, ax = plt.subplots()
ax.scatter(df['x'], df['y'])
for i, txt in enumerate(df['label']):
    ax.annotate(f"{txt} - how2matplotlib.com", (df['x'][i], df['y'][i]),
                bbox=dict(facecolor='yellow', alpha=0.5))

plt.show()
Output:
Example 9: Annotating with Multiple Lines of Text
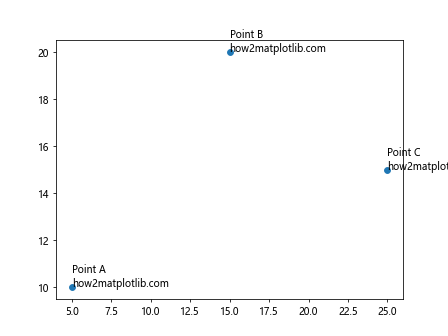
Sometimes, you might want to include multiple lines of text in an annotation.
import matplotlib.pyplot as plt
import pandas as pd

# Create a DataFrame
df = pd.DataFrame({
    'x': [5, 15, 25],
    'y': [10, 20, 15],
    'label': ['Point A', 'Point B', 'Point C']
})

# Plotting
fig, ax = plt.subplots()
ax.scatter(df['x'], df['y'])
for i, txt in enumerate(df['label']):
    ax.annotate(f"{txt}\nhow2matplotlib.com", (df['x'][i], df['y'][i]))

plt.show()
Output:
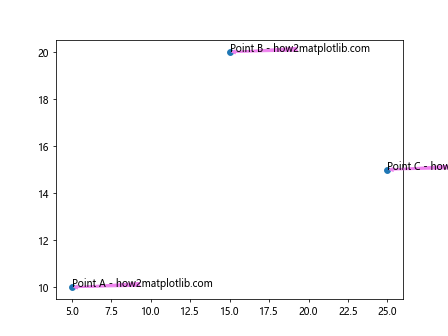
Example 10: Annotating with Custom Arrow Styles
Customizing the arrow style can make annotations stand out or better match the style of the plot.
import matplotlib.pyplot as plt
import pandas as pd

# Create a DataFrame
df = pd.DataFrame({
    'x': [5, 15, 25],
    'y': [10, 20, 15],
    'label': ['Point A', 'Point B', 'Point C']
})

# Plotting
fig, ax = plt.subplots()
ax.scatter(df['x'], df['y'])
for i, txt in enumerate(df['label']):
    ax.annotate(f"{txt} - how2matplotlib.com", (df['x'][i], df['y'][i]),
                arrowprops=dict(arrowstyle="fancy", color='violet'))

plt.show()
Output:
Example 11: Annotating with Rotation
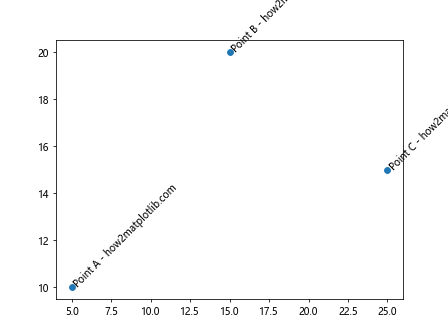
Rotating text annotations can help fit more text without cluttering the plot.
import matplotlib.pyplot as plt
import pandas as pd

# Create a DataFrame
df = pd.DataFrame({
    'x': [5, 15, 25],
    'y': [10, 20, 15],
    'label': ['Point A', 'Point B', 'Point C']
})

# Plotting
fig, ax = plt.subplots()
ax.scatter(df['x'], df['y'])
for i, txt in enumerate(df['label']):
    ax.annotate(f"{txt} - how2matplotlib.com", (df['x'][i], df['y'][i]),
                rotation=45)

plt.show()
Output:
Example 12: Annotating with Different Font Sizes
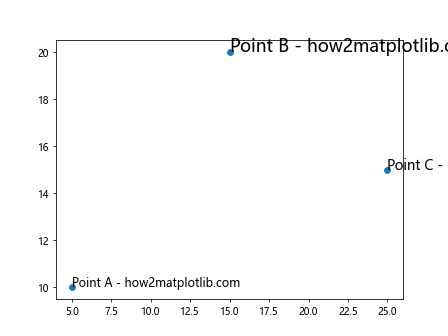
Varying the font size of annotations based on a certain criterion can be very useful.
import matplotlib.pyplot as plt
import pandas as pd

# Create a DataFrame
df = pd.DataFrame({
    'x': [5, 15, 25],
    'y': [10, 20, 15],
    'label': ['Point A', 'Point B', 'Point C']
})

# Plotting
sizes = [12, 18, 14]
fig, ax = plt.subplots()
ax.scatter(df['x'], df['y'])
for i, txt in enumerate(df['label']):
    ax.annotate(f"{txt} - how2matplotlib.com", (df['x'][i], df['y'][i]),
                fontsize=sizes[i])

plt.show()
Output:
Example 13: Annotating with ConnectionStyle
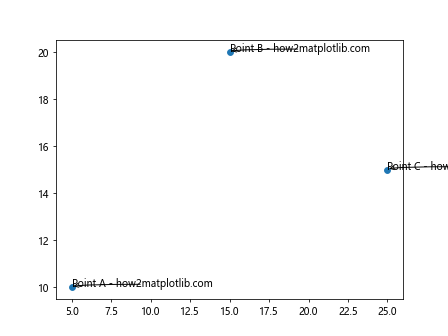
Using different connection styles for arrows can help in avoiding overlapping or to better direct the attention.
import matplotlib.pyplot as plt
import pandas as pd

# Create a DataFrame
df = pd.DataFrame({
    'x': [5, 15, 25],
    'y': [10, 20, 15],
    'label': ['Point A', 'Point B', 'Point C']
})

# Plotting
fig, ax = plt.subplots()
ax.scatter(df['x'], df['y'])
for i, txt in enumerate(df['label']):
    ax.annotate(f"{txt} - how2matplotlib.com", (df['x'][i], df['y'][i]),
                arrowprops=dict(arrowstyle="->", connectionstyle="angle3,angleA=0,angleB=-90"))

plt.show()
Output:
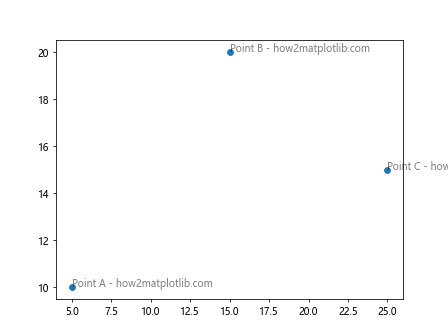
Example 14: Annotating with Alpha Transparency
Adjusting the transparency of annotations can help in maintaining focus on the plot while still providing information.
import matplotlib.pyplot as plt
import pandas as pd

# Create a DataFrame
df = pd.DataFrame({
    'x': [5, 15, 25],
    'y': [10, 20, 15],
    'label': ['Point A', 'Point B', 'Point C']
})

# Plotting
fig, ax = plt.subplots()
ax.scatter(df['x'], df['y'])
for i, txt in enumerate(df['label']):
    ax.annotate(f"{txt} - how2matplotlib.com", (df['x'][i], df['y'][i]),
                alpha=0.5)

plt.show()
Output:
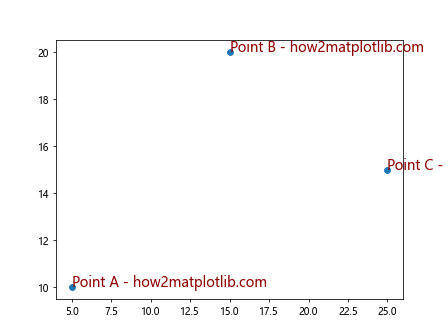
Example 15: Annotating with Multiple Fonts and Styles
Combining multiple font styles and sizes in annotations can make them more dynamic and engaging.
import matplotlib.pyplot as plt
import pandas as pd

# Create a DataFrame
df = pd.DataFrame({
    'x': [5, 15, 25],
    'y': [10, 20, 15],
    'label': ['Point A', 'Point B', 'Point C']
})

# Plotting
fig, ax = plt.subplots()
ax.scatter(df['x'], df['y'])
for i, txt in enumerate(df['label']):
    ax.annotate(f"{txt} - how2matplotlib.com", (df['x'][i], df['y'][i]),
                fontstyle='italic', fontsize=14, color='darkred')

plt.show()
Output:
These examples illustrate various ways to annotate points in a Matplotlib plot using data from a Pandas DataFrame. By customizing annotations, you can make your plots more informative and appealing.