Matplotlib 3D Scatter
Matplotlib is a powerful data visualization library in Python that allows you to create stunning 2D and 3D plots. In this article, we will focus on creating 3D scatter plots using Matplotlib.
Introduction to 3D Scatter Plots
A 3D scatter plot is used to visualize data points in a three-dimensional space. Each point in the plot has three coordinates: x, y, and z. This type of plot is useful for visualizing relationships in multidimensional data and identifying patterns.
Let’s start by creating a simple 3D scatter plot using Matplotlib. First, we need to import the necessary libraries:
import matplotlib.pyplot as plt
from mpl_toolkits.mplot3d import Axes3D
import numpy as np
Next, we will generate some random data points and create a 3D scatter plot:
import matplotlib.pyplot as plt
from mpl_toolkits.mplot3d import Axes3D
import numpy as np

# generate random data
x = np.random.rand(100)
y = np.random.rand(100)
z = np.random.rand(100)

# create a 3D scatter plot
fig = plt.figure()
ax = fig.add_subplot(111, projection='3d')
ax.scatter(x, y, z)

# set labels and title
ax.set_xlabel('X Label')
ax.set_ylabel('Y Label')
ax.set_zlabel('Z Label')
ax.set_title('3D Scatter Plot')

plt.show()
Output:
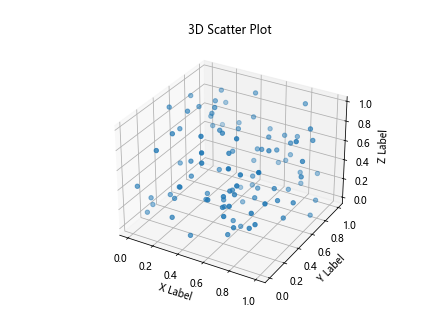
When you run the above code, you should see a 3D scatter plot with randomly generated data points.
Customizing 3D Scatter Plots
Matplotlib allows you to customize your 3D scatter plots by changing the color, size, and shape of the data points. Let’s create a more customized 3D scatter plot using the following code:
import matplotlib.pyplot as plt
from mpl_toolkits.mplot3d import Axes3D
import numpy as np

# generate random data
x = np.random.rand(100)
y = np.random.rand(100)
z = np.random.rand(100)

# create a custom 3D scatter plot
fig = plt.figure()
ax = fig.add_subplot(111, projection='3d')
ax.scatter(x, y, z, c='r', marker='^', s=100)

# set labels and title
ax.set_xlabel('X Label')
ax.set_ylabel('Y Label')
ax.set_zlabel('Z Label')
ax.set_title('Custom 3D Scatter Plot')

plt.show()
Output:
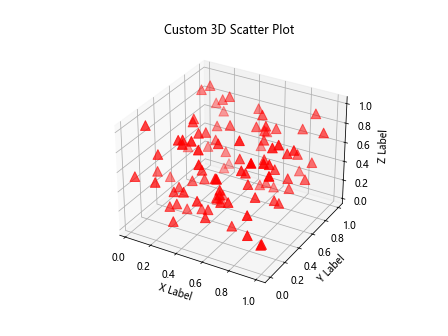
In this code snippet, we have customized the 3D scatter plot by changing the color to red, the marker shape to a triangle (^), and the size of the data points to 100.
Adding a Colorbar
You can add a colorbar to a 3D scatter plot to represent a fourth dimension in your data. Let’s create a 3D scatter plot with a colorbar using the following code:
import matplotlib.pyplot as plt
from mpl_toolkits.mplot3d import Axes3D
import numpy as np

# generate random data
x = np.random.rand(100)
y = np.random.rand(100)
z = np.random.rand(100)
c = np.random.rand(100)  # random color values

# create a 3D scatter plot with colorbar
fig = plt.figure()
ax = fig.add_subplot(111, projection='3d')
colormap = plt.get_cmap('cool')  # choose a colormap
sc = ax.scatter(x, y, z, c=c, cmap=colormap)
plt.colorbar(sc)

# set labels and title
ax.set_xlabel('X Label')
ax.set_ylabel('Y Label')
ax.set_zlabel('Z Label')
ax.set_title('3D Scatter Plot with Colorbar')

plt.show()
Output:
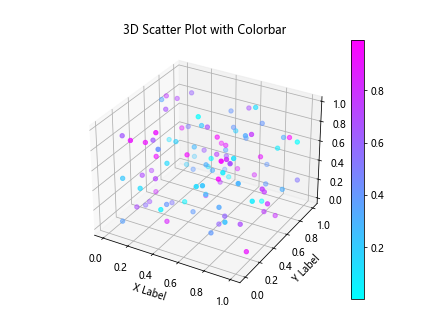
The colorbar in the plot represents the additional dimension (in this case, the random color values) in the data.
Plotting Multiple 3D Scatter Plots
You can plot multiple 3D scatter plots on the same figure to compare different datasets or visualize complex relationships. Let’s create two 3D scatter plots on the same figure using the following code:
import matplotlib.pyplot as plt
from mpl_toolkits.mplot3d import Axes3D
import numpy as np

# generate random data for plot 1
x1 = np.random.rand(100)
y1 = np.random.rand(100)
z1 = np.random.rand(100)

# generate random data for plot 2
x2 = np.random.rand(100)
y2 = np.random.rand(100)
z2 = np.random.rand(100)

# create multiple 3D scatter plots
fig = plt.figure()
ax = fig.add_subplot(111, projection='3d')
ax.scatter(x1, y1, z1, c='r', label='Plot 1')
ax.scatter(x2, y2, z2, c='b', label='Plot 2')

# set labels and title
ax.set_xlabel('X Label')
ax.set_ylabel('Y Label')
ax.set_zlabel('Z Label')
ax.set_title('Multiple 3D Scatter Plots')
plt.legend()

plt.show()
Output:
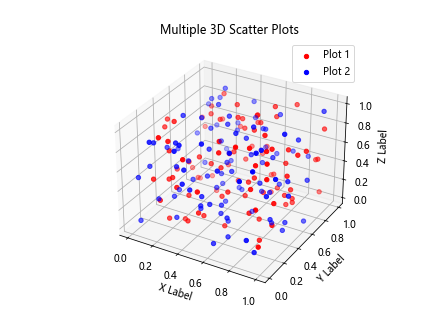
This code snippet creates two 3D scatter plots with different colors and labels on the same figure.
Interactive 3D Scatter Plots
Matplotlib provides interactive features for 3D plots, allowing you to rotate, zoom, and pan the plot to explore the data visually. Let’s create an interactive 3D scatter plot using the following code:
import matplotlib.pyplot as plt
from mpl_toolkits.mplot3d import Axes3D
import numpy as np

# generate random data
x = np.random.rand(100)
y = np.random.rand(100)
z = np.random.rand(100)

# create an interactive 3D scatter plot
fig = plt.figure()
ax = fig.add_subplot(111, projection='3d')
sc = ax.scatter(x, y, z)

# set labels and title
ax.set_xlabel('X Label')
ax.set_ylabel('Y Label')
ax.set_zlabel('Z Label')
ax.set_title('Interactive 3D Scatter Plot')

def on_click(event):
    azim, elev = ax.azim, ax.elev
    if event.key == 'a':
        azim -= 10
    elif event.key == 'd':
        azim += 10
    elif event.key == 'w':
        elev += 10
    elif event.key == 's':
        elev -= 10
    ax.view_init(elev=elev, azim=azim)
    plt.draw()

fig.canvas.mpl_connect('key_press_event', on_click)
plt.show()
Output:
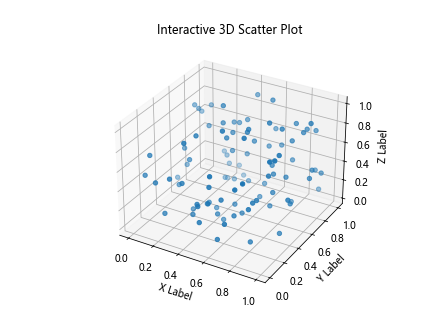
You can rotate the plot by pressing the arrow keys (‘a’ to rotate left, ‘d’ to rotate right, ‘w’ to rotate up, and ‘s’ to rotate down).
Adding Annotations to 3D Plots
Annotations can be added to 3D scatter plots to provide additional information about specific data points or regions. Let’s add annotations to a 3D scatter plot using the following code:
import matplotlib.pyplot as plt
from mpl_toolkits.mplot3d import Axes3D
import numpy as np

# generate random data
x = np.random.rand(100)
y = np.random.rand(100)
z = np.random.rand(100)

# create a 3D scatter plot with annotations
fig = plt.figure()
ax = fig.add_subplot(111, projection='3d')
ax.scatter(x, y, z)

# add annotations to specific data points
for i in range(10):
    ax.text(x[i], y[i], z[i], f'Point {i}', color='black')

# set labels and title
ax.set_xlabel('X Label')
ax.set_ylabel('Y Label')
ax.set_zlabel('Z Label')
ax.set_title('3D Scatter Plot with Annotations')

plt.show()
Output:
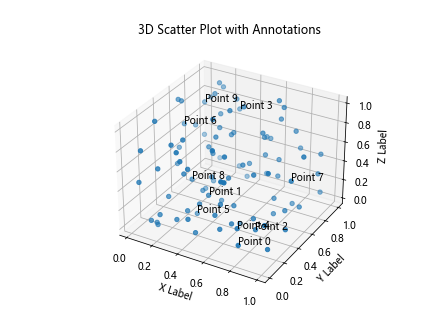
In this code snippet, we add annotations to the first 10 data points in the 3D scatter plot.
Subplots with 3D Scatter Plots
You can create subplots with multiple 3D scatter plots to compare different datasets or visualize multiple dimensions. Let’s create subplots with two 3D scatter plots using the following code:
import matplotlib.pyplot as plt
from mpl_toolkits.mplot3d import Axes3D
import numpy as np

# generate random data for subplot 1
x1 = np.random.rand(100)
y1 = np.random.rand(100)
z1 = np.random.rand(100)

# generate random data for subplot 2
x2 = np.random.rand(100)
y2 = np.random.rand(100)
z2 = np.random.rand(100)

# create subplots with 3D scatter plots
fig = plt.figure()

# subplot 1
ax1 = fig.add_subplot(121, projection='3d')
ax1.scatter(x1, y1, z1, c='r')
ax1.set_title('Subplot 1')

# subplot 2
ax2 = fig.add_subplot(122, projection='3d')
ax2.scatter(x2, y2, z2, c='b')
ax2.set_title('Subplot 2')

plt.show()
Output:
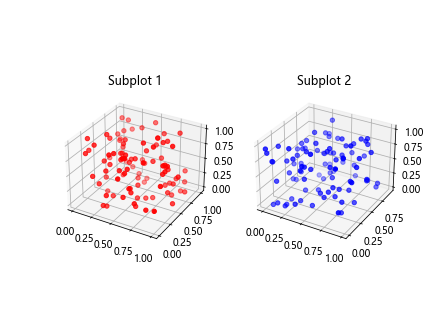
In this code snippet, we create two subplots, each containing a 3D scatter plot with different random data.
Surface Plot from 3D Scatter Data
You can generate a surface plot from 3D scatter data using interpolation techniques like meshgrid. Let’s create a surface plot from 3D scatter data using the following code:
import matplotlib.pyplot as plt
from mpl_toolkits.mplot3d import Axes3D
import numpy as np

# generate random data
x = np.random.rand(100)
y = np.random.rand(100)
z = np.random.rand(100)

# create a surface plot from 3D scatter data
fig = plt.figure()
ax = fig.add_subplot(111, projection='3d')

# create a meshgrid for interpolation
X, Y = np.meshgrid(np.linspace(min(x), max(x), 100), np.linspace(min(y), max(y), 100))
Z = np.interp(X, x, z)

# plot the surface
ax.plot_surface(X, Y, Z, cmap='viridis')

# set labels and title
ax.set_xlabel('X Label')
ax.set_ylabel('Y Label')
ax.set_zlabel('Z Label')
ax.set_title('Surface Plot from 3D Scatter Data')

plt.show()
Output:
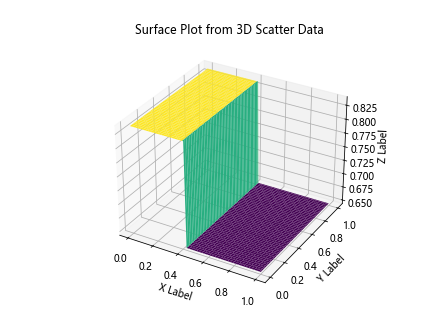
This code snippet demonstrates how to create a surface plot from 3D scatter data using interpolation.
Saving 3D Scatter Plots
You can save your 3D scatter plots as image files in various formats such as PNG, JPEG, or PDF. Let’s create a 3D scatter plot and save it as a PNG image using the following code:
import matplotlib.pyplot as plt
from mpl_toolkits.mplot3d import Axes3D
import numpy as np

# generate random data
x = np.random.rand(100)
y = np.random.rand(100)
z = np.random.rand(100)

# create a 3D scatter plot
fig = plt.figure()
ax = fig.add_subplot(111, projection='3d')
ax.scatter(x, y, z)

# set labels and title
ax.set_xlabel('X Label')
ax.set_ylabel('Y Label')
ax.set_zlabel('Z Label')
ax.set_title('3D Scatter Plot')

plt.savefig('3D_scatter_plot.png')
After running this code, you should see a PNG image file named ‘3D_scatter_plot.png’ saved in the working directory.
These are just a few examples of how to create and customize 3D scatter plots using Matplotlib. By exploring the various functionalities and options available in Matplotlib, you can create complex and informative 3D visualizations to analyze your data effectively. Experiment with different settings, styles, and techniques to enhance your plots and make them more visually appealing.